The Market’s Second Chance Horses: When Punters Give Up Too Soon
The Market’s Second Chance Horses: When Punters Give Up Too Soon
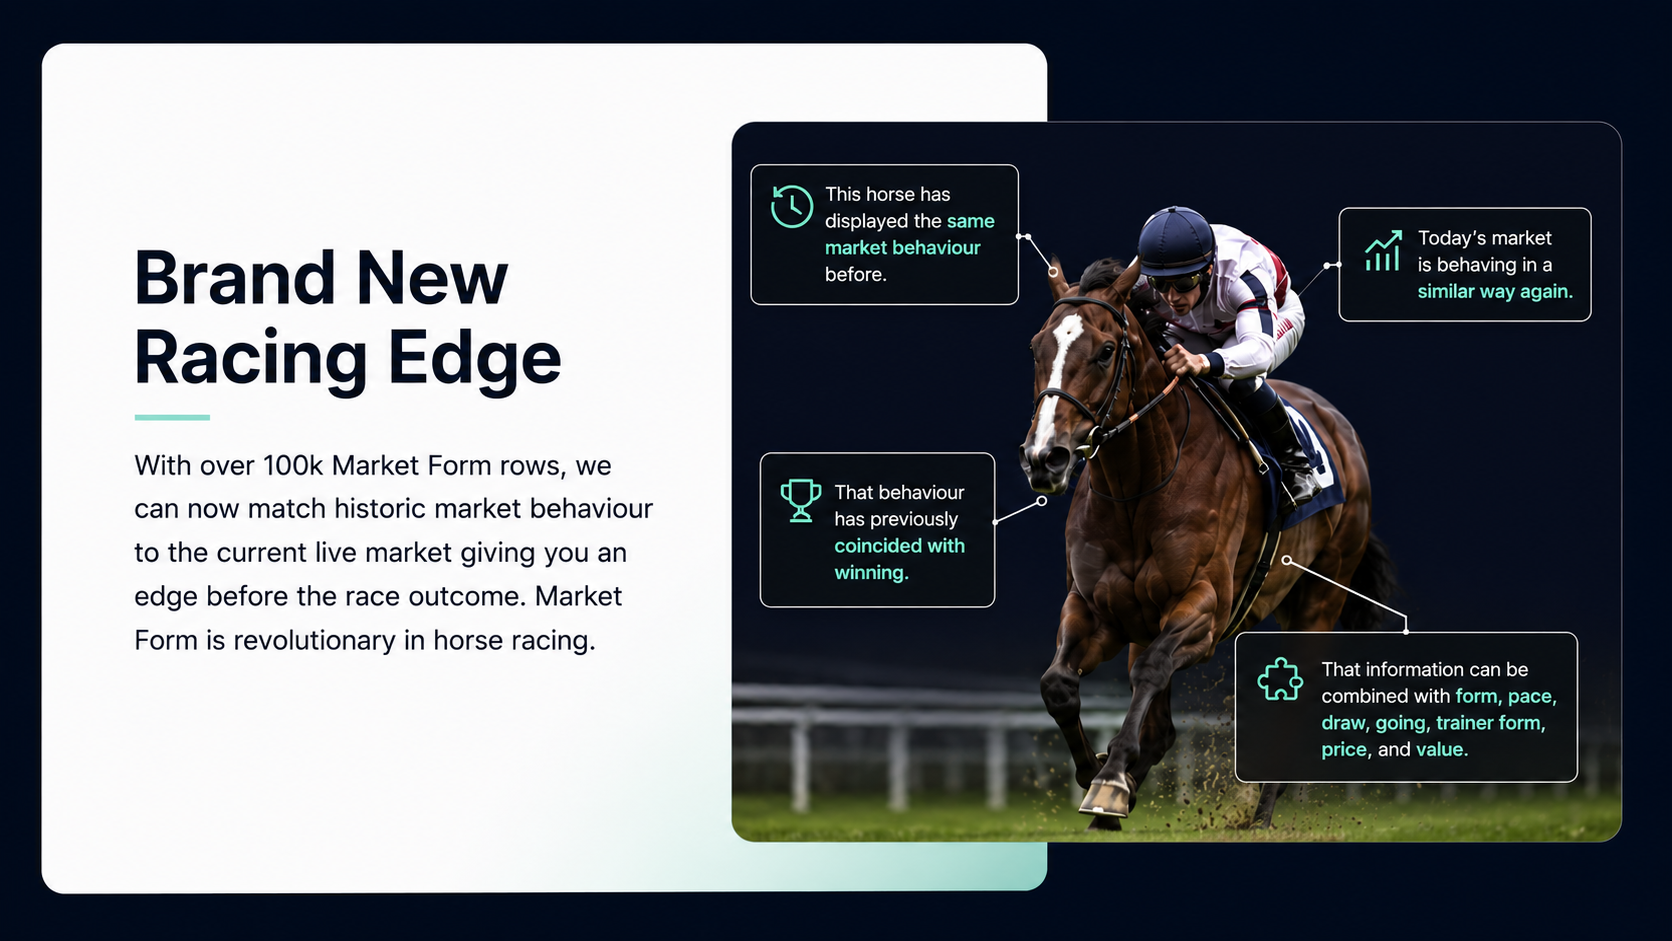
One of the biggest advantages of building Market Form is that it allows us to investigate what happens after a significant market event.
Most punters focus on the event itself.
We can focus on what comes next.
Recently I investigated horses that attracted strong late support between the 1pm market anchor and Starting Price. Specifically, I looked at runners that shortened by at least 30% in the final stages of betting.
The initial findings were surprising.
The Obvious Theory Didn’t Work
The first group examined were horses that:
- Shortened by 30% or more between the 1pm anchor and SP.
- Finished first or second.
These were horses where the market appeared to be right.
The support arrived.
The horse ran well.
Naturally, the assumption was that these horses would be worth following next time.
The results were disastrous.
- 385 bets
- 59 winners
- 116 placed
- -138.46 points
- -35.96% ROI
Far from identifying future winners, these horses became some of the worst bets in the database.
The market had already done the hard work.
By the time they reappeared, everybody knew about them.
The previous gamble was priced in.
Turning The Question Around
That led to a more interesting idea.
What about the horses the market loved but which failed to deliver?
The market backed them heavily.
The horse disappointed.
The public moved on.
Could that create opportunity?
To test the theory I examined horses that:
- Shortened by 30% or more between the 1pm anchor and SP.
- Failed to finish in the first two.
- Were then backed blindly on their next start.
The results improved slightly but remained unprofitable.
- 1,247 bets
- 111 winners
- 248 placed
- -340.69 points
- -27.32% ROI
At first glance it looked like another dead end.
But digging deeper revealed something far more interesting.
The Market Still Believes
The next step was to examine how these horses were priced when they returned.
I split them by their opening price on their next start.
| Next Run Opening Price | Bets | Profit/Loss | ROI |
|---|---|---|---|
| ≤ 2.0 | 8 | +0.37 | +4.63% |
| 2.0 – 3.0 | 36 | +7.13 | +19.81% |
| 3.0 – 5.0 | 131 | -17.05 | -13.02% |
| 5.0 – 8.0 | 215 | -21.21 | -9.87% |
| 8.0+ | 841 | -296.55 | -35.26% |
Now we had something.
The profitable area wasn’t the obvious longshots.
It wasn’t the horses everybody had abandoned.
It was the opposite.
The horses that disappointed but still returned as strong market favourites.
The market appeared willing to forgive one poor performance.
The Crucial Question
If these horses were opening short next time, what happened during the day?
Were punters backing them again?
Or drifting away from them?
This is where things became genuinely fascinating.
I looked only at the horses that:
- Had been heavily backed on their previous start.
- Failed to finish in the first two.
- Returned next time opening at 3.0 or shorter.
Then I measured what happened between opening and SP.
The Market Misses Them
| Next Run Market Move | Bets | Winners | Profit | ROI |
|---|---|---|---|---|
| Drift 20%+ | 25 | 9 | +17.87 | +71.48% |
| Backed 20%+ | 6 | 3 | -0.12 | -2.00% |
| Backed 10-20% | 3 | 1 | -1.47 | -49.00% |
| Little Change | 4 | 1 | -2.78 | -69.50% |
| Drift 10-20% | 3 | 0 | -3.00 | -100.00% |
| Drift <10% | 3 | 0 | -3.00 | -100.00% |
The sample sizes are small, so caution is essential.
However, the behaviour is fascinating.
The profitable group wasn’t the horses being backed.
It was the horses that opened as strong favourites and then drifted significantly.
The market was effectively saying:
“We fancied this horse last time and it let us down.”
Then on the next run:
“We’re starting to lose confidence.”
Yet those were precisely the horses producing the best results.
A Market Form Lesson
Most punters think market support is a binary signal.
Backed equals good.
Drifting equals bad.
Reality is often more nuanced.
The strongest signal in this study wasn’t support.
It was persistent confidence.
These horses had already been heavily backed once.
They had already disappointed.
Yet the market still opened them as short-priced runners on their next start.
That alone may be telling us something.
Connections still believed.
Bookmakers still respected them.
The market still rated them.
And when punters finally started to lose patience, value may have started to reappear.
Where This Research Goes Next
The next stage is obvious.
We need larger samples.
We need to investigate:
- Trainer patterns.
- Handicap versus non-handicap races.
- Class movements.
- Distance changes.
- Whether these horses were returning quickly or after breaks.
But one thing is already clear.
The obvious story wasn’t profitable.
The horse that was heavily backed and justified the gamble proved a terrible next-time bet.
The more interesting story may be the horse that was heavily backed, disappointed everyone, and then quietly returned before the market had fully decided what to think.
That’s exactly the type of behaviour Market Form was built to uncover.