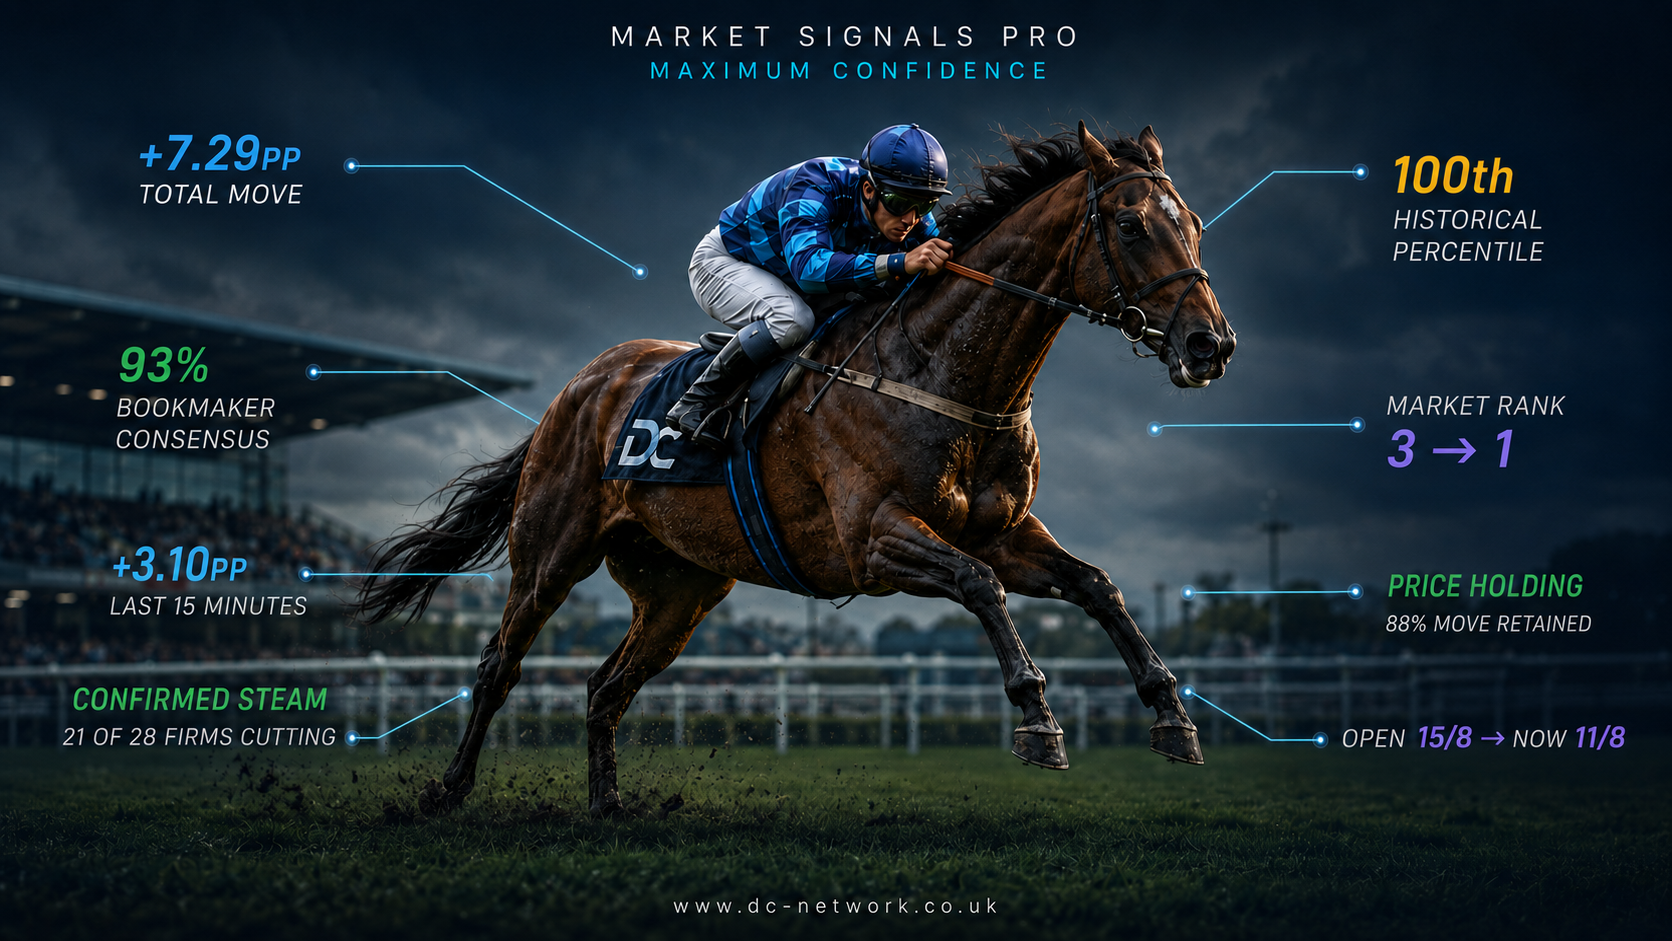

DC Market Intelligence Report –Sep 13, 2026
What the market knew, what the results proved, and what the evidence means for today.
Yesterday’s Market Scorecard
Underperformed expectation
01 The Market Verdict
Yesterday’s strong-steamer cohort underperformed the win expectation at final prices. The group produced 11 winners from 90 qualifiers (12.2% win rate) against 12.49 expected, giving a performance index of 88.1. That is not a collapse in signal, but it is clear evidence that—on the day—late contraction was not reliably translating into wins at the rate the closing market implied.
The more important context is that this is not isolated noise. Over the last 30 days (2,256 qualifiers), the profile is similar: 317 winners versus 362.38 expected, performance index 87.5. In other words, the closing-price “probability” attached to these strong steamers has been running hot relative to realised outcomes for a sustained period. That does not mean every steamer is wrong; it means the subset defined here (≥15% contraction from 10am to final) has, on aggregate, been overbet at the close.
The P/L split reinforces what that overbetting looks like in practice. Theoretical level-stakes P/L at 10am is negative yesterday (-12.74 pts) but massively positive over 30 days (+496.93 pts), while the SP line is negative both yesterday (-35.54 pts) and over 30 days (-373.05 pts). The market evidence is that the edge—where it exists—has been earlier in the day, with value largely given back (and more) by the time the crowd has finished compressing prices late.
02 Market Beaters vs Money That Misfired
Market beaters
- Quddwah (2.88→2.00) converted at a compressed price; this is the cleanest expression of the steamer thesis—support held, probability rose, and the result matched.
- Espanita (4.50→3.00) delivered a decisive win with a sizeable late contraction; notably, the market was still willing to shorten after a positive Open→10am move, suggesting momentum rather than a single timing blip.
- Boxing Great (2.63→2.00) and Darkness Falls (2.50→2.00) show the “shorter end” functioning: when the market forces a strong favourite/near-favourite into even tighter odds, it can still be right—just not consistently enough in aggregate yesterday.
- Green Icon (7.00→5.00; SP 2.88) is the standout on price tension: the win arrived despite the SP ending shorter than final, signalling a race where late money kept concentrating beyond the final snapshot.
- Air Force One (12.00→8.00; SP 6.50) and Highwayman (15.00→12.00) represent mid-price steam that did not need extreme compression to land.
Money that misfired
- Cowardofthecounty (51.00→12.00) is the day’s loudest warning: a massive contraction can still end mid-division (pos 5). This is what overbetting looks like—price confidence outrunning outcome.
- Jesus Green (26.00→13.00, pos 2) and Orchard Hatches (19.00→8.00, pos 3) are important qualifiers despite not winning: the market found them and they ran to a competitive level, but not to the win probability implied by the close.
- Henfield (15.00→8.00, pos 2) is a near-miss paired with an extreme Open→10am move (-21.90pp). The support was not a gentle late “smart” nudge; it was aggressive throughout, yet still fell short.
- Due Respect (15.00→8.00, pos 3) again shows that the steamer set produced plenty of placing (31 places overall), but the conversion rate lagged what the final market asked of them.
- The long-priced plunges—Indian Mary (81.00→41.00, pos 5) and the Leopardstown outsiders such as Dawn Rising and Carnival Of Light—underline a structural issue: big percentage contractions at big odds can be visually dramatic while only adding modest win probability, and they were not close to cashing.
03 Where the Money Went
Repeated connections
- Trainer concentration was clear, led by Joseph Patrick O’Brien (9 backed / 1 won) and A P O’Brien (6 / 1). That is meaningful as a map of where syndicated and stable money may have been looking, but one day’s strike-rate is not proof of any stable-wide “hot” or “cold” condition.
- Among smaller samples, G M Lyons (3 / 1) and Charlie Johnston (2 / 1) converted support more efficiently yesterday than the high-volume yards, but the counts are too small to elevate beyond observation.
- Jockey support clustered around top names without translating cleanly into results: Ryan Moore (4 / 1) was the most backed, while Declan McDonogh, Colin Keane and David Egan were all 0-from-3 despite repeated market support.
- James Doyle, Daniel Tudhope and Jason Hart each went 1-from-2, which reads as solid execution on the day rather than a durable angle on its own.
The other side of the market
- The strongest late drifters were not uniformly “lays.” Desert Castle (1.73→2.00) won despite drifting, a reminder that drift can be about price discovery and liquidity, not necessarily negative information.
- Several prominent drifters still ran well enough to place: Yazoo (1.25→1.5, pos 3), Night Star (1.73→2.1, pos 3), Needin’ U (2.9→4, pos 3) and Royal Duke (3.25→4.5, pos 3). The market cooled, but ability remained; it was the win chance that was being repriced down.
- At bigger prices, drift did not preclude competitiveness either: The Pug (6.5→13, pos 2) is the clean example of a horse the market wanted to oppose late, yet it still nearly won.
- Read across both sides: yesterday’s evidence points to a market that was active and opinionated late, but not consistently “right” on the win line—whether shortening or easing.
04 The Practical Read
- Use late steam as a confirmation layer, not a decision engine. With a one-day PI of 88.1 and a 30-day PI of 87.5, the closing market has been pricing this subset as more likely to win than results have supported.
- Separate “looks dramatic” from “adds probability.” Huge percentage contractions at long odds (e.g., 50/1 into teens) can be eye-catching while still leaving the horse with a low implied chance; treat these as information, but keep expectations proportional.
- Respect places as signal quality, but price them correctly. Yesterday’s 34.4% place rate shows the market often identified contenders; the issue is that final prices implied more outright winning than materialised.
- Track where the edge sits in time. The 30-day split—positive at 10am (+496.93 pts) and negative at SP (-373.05 pts)—is consistent with value being earlier and being eroded by late compression. Watch whether the late move is merely “catch-up” to a price that was already value earlier.
- Interpret pp movement in context. The average Open→10am move was small (-0.92pp) versus a much larger average 10am→final move (3.51pp), so much of the day’s information arrived late. Where you see aggressive early support (as with Henfield), treat it differently from a gentle late squeeze.
- Sample size discipline matters: one day can be noisy, but the 30-day pattern is not. If you are weighting market signals in your process, weight the rolling evidence more heavily than yesterday’s variance.
- No filter-supplied qualifiers were available at generation time today, so there is no named short-list to anchor decisions; the Live Market needs to be read race-by-race using price behaviour and confirmation rather than pre-baked selections.
Data AppendixMethod and report totals
- Report generated
- 2026-09-13 10:03:50
- Analysis date
- 2026-09-12
- Strong steamer threshold
- 15%
- Races
- 47
- Runners
- 467
- Strong steamers
- 90
- Landed
- 11
- Missed
- 79
- False steamers listed
- 10
- Trainers tracked
- 12
- Jockeys tracked
- 12
- Qualifiers today
- 0
- Expected winners
- 12.49
- Performance index
- 88.1
- Placed
- 31
- 10am level-stakes P/L
- -12.74 pts
- 30-day qualifiers
- 2256