
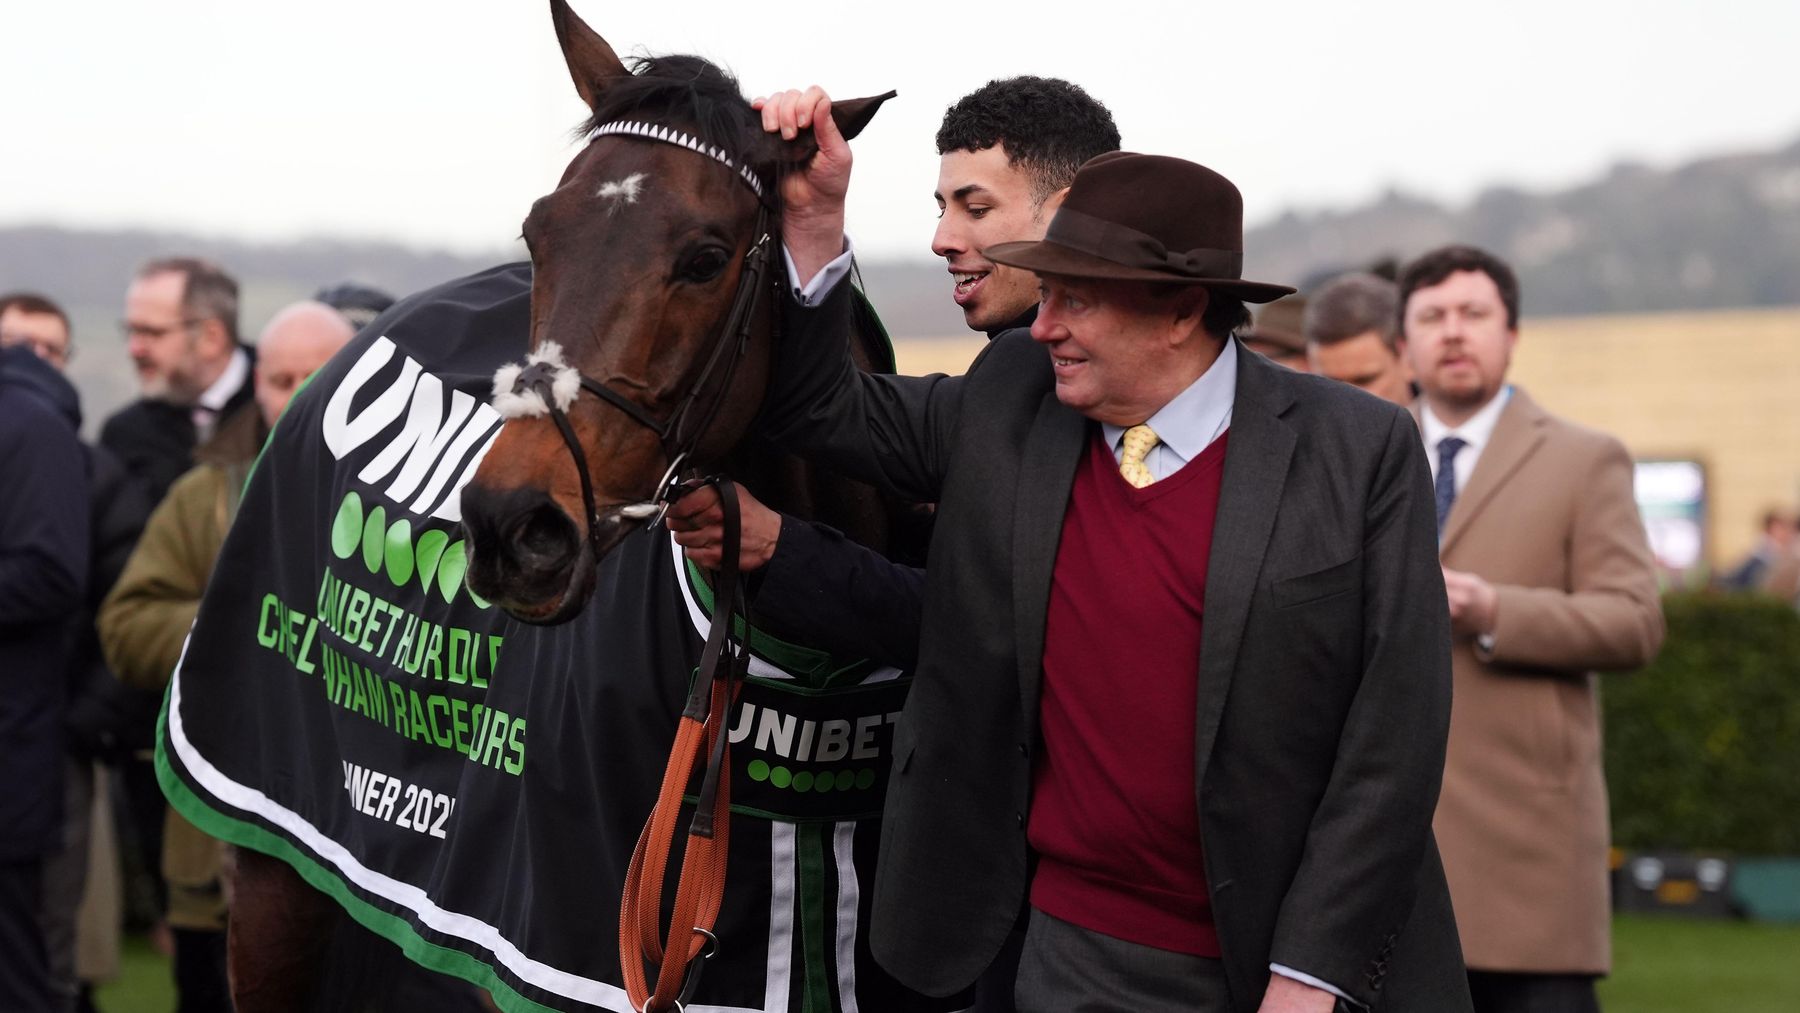
Why the market support for Tom Ward has mattered – and the drifters demanding caution
Market Form examines which yards have delivered when their runners are backed, where drifting horses have underperformed and the precise support levels that have changed the picture.

The market can say plenty without saying a word. A shortening price does not guarantee intent and a drift does not automatically remove a horse from calculations, but repeated behaviour across a meaningful sample can reveal where the betting has carried unusual significance.
This week’s Stable Report separates the eye-catching from the dependable. Every figure below is calculated from completed GB and Irish bookmaker markets, with price movement expressed in implied-probability points rather than potentially misleading percentage price changes.
Backed yards in form
Tom Ward provides the week’s most persuasive example. A routine market fluctuation is one thing; 6 winners from 10 runners backed by at least 4pp is another. That 60.0% strike rate stands 51.4 points above the yard’s ordinary 8.6% strike rate, giving the move a weight that the raw price change alone cannot provide.
The same broad message emerges elsewhere, although by a different route. Anthony Honeyball has converted 5 of 7 similarly supported runners, lifting a baseline of 27.3% to 71.4%. Faye Bramley belongs in the conversation too: 8 winners from 13 backed runners represents a 61.5% strike rate, compared with 22.2% normally. The figures are not identical, but the conclusion is consistent—the market has identified a materially stronger subset of each yard’s runners.
Nor does the evidence end with the headline names. Adrian Paul Keatley (5/8, 62.5%) and Kevin Thomas Coleman (4/8, 50.0%) complete a wider picture in which support has repeatedly isolated the runners most capable of improving on their yards’ standard returns. The samples remain visible in the table below; that matters, because an exceptional percentage deserves more confidence when it has been earned across more than a handful of bets.
| Trainer | Backed runners | Wins | Backed SR | Normal SR | Uplift |
|---|---|---|---|---|---|
| Tom Ward | 10 | 6 | 60.0% | 8.6% | +51.4pp |
| Anthony Honeyball | 7 | 5 | 71.4% | 27.3% | +44.1pp |
| Faye Bramley | 13 | 8 | 61.5% | 22.2% | +39.3pp |
| Adrian Paul Keatley | 8 | 5 | 62.5% | 21.2% | +41.3pp |
| Kevin Thomas Coleman | 8 | 4 | 50.0% | 9.3% | +40.7pp |
When weakness has mattered
A bigger price is not a verdict in itself. The warning comes when a yard’s drifting runners repeatedly fall below the trainer’s ordinary level, and when enough examples exist to make that gap worth respecting.
The sharpest contrast comes from Tristan Davidson. The yard’s normal 21.7% strike rate falls to 0.0% among 21 runners that drifted by at least 4pp. Only 0 won, a drop of 21.7 points which turns market weakness from a passing observation into evidence worth factoring into a bet.
It is a pattern echoed by Roger Varian, whose 4pp-plus drifters returned 8 wins from 74 attempts (10.8%) against a normal 24.0%; and Neil King, whose 4pp-plus drifters returned 1 wins from 11 attempts (9.1%) against a normal 28.1%. None of that proves an individual horse cannot outrun a drift. It does show that, for these yards, weakness has historically coincided with a less productive group of runners.
The supporting evidence around Harriet Bethell and Billy Aprahamian is less dramatic but points in the same direction. These are warning records rather than automatic lays—the value lies in knowing when a drift agrees with a trainer’s longer-term market profile.
| Trainer | 4pp+ drifters | Wins | Drift SR | Normal SR | Drop |
|---|---|---|---|---|---|
| Tristan Davidson | 21 | 0 | 0.0% | 21.7% | -21.7pp |
| Roger Varian | 74 | 8 | 10.8% | 24.0% | -13.2pp |
| Neil King | 11 | 1 | 9.1% | 28.1% | -19.0pp |
| Harriet Bethell | 14 | 0 | 0.0% | 18.3% | -18.3pp |
| Billy Aprahamian | 13 | 0 | 0.0% | 16.4% | -16.4pp |
The support sweet spot
For some yards, mild support is little more than market noise. Their record changes only after the move reaches a more demanding level. These are the thresholds at which the evidence becomes materially stronger.
Anthony Honeyball has produced its clearest change once support reached 15pp. At that level the yard has recorded 6 winners from 8 qualifiers, a 75.0% strike rate and an uplift of 57.2 points. That distinction is crucial: ordinary support and support that reaches the trainer’s proven line are not the same piece of evidence.
The trigger is not universal. Faye Bramley requires 10pp before the record steps forward, at which point 8 of 12 qualifiers won, while Gary & Josh Moore requires 15pp before the record steps forward, at which point 10 of 16 qualifiers won. Reading the yards through their own thresholds avoids treating every blue market move as if it carried equal force.
The remaining lines—David Menuisier at 8pp and Tim Easterby at 15pp—reinforce the point. The useful question is not merely whether money has arrived, but whether enough has arrived to match the circumstances in which that trainer has previously improved.
| Trainer | Support line | Qualifiers | Wins | Strike rate | Uplift |
|---|---|---|---|---|---|
| Anthony Honeyball | 15pp+ | 8 | 6 | 75.0% | +57.2pp |
| Faye Bramley | 10pp+ | 12 | 8 | 66.7% | +51.9pp |
| Gary & Josh Moore | 15pp+ | 16 | 10 | 62.5% | +49.6pp |
| David Menuisier | 8pp+ | 10 | 6 | 60.0% | +51.0pp |
| Tim Easterby | 15pp+ | 15 | 8 | 53.3% | +44.8pp |